1 ENTRY Techniques for breakouts and Bounces
A breakout ENTRY is when the price approaches your entry level and continues in the direction that it has been going. Traders do continuation trades in the direction of the existing trend.
Often the term breakout is often used to describe a breakout of a side ways consolidation too.
Bounce or retracement ENTRIES are when the trader expects the price to bounce or retrace from a specific price level and return into the direction it has just come from. They therefore trade directly against the short term trend.
BOUNCE ENTRY TECHNIQUES
1.1 Multiple moving average Breakout trades
Multiple moving averages give a great quick overview of the market. When the moving averages are pointing in the same direction or flaring out the market is trending (see the daily chart below).
When they are moving towards each other and crisscrossing, the market is consolidating (see the 4 hour chart below). When the market is trending one would use trending or continuation approaches and when consolidating one will use retracement techniques. Extreme consolidations (orange dots on the charts below) are often warnings of breakout trends.
The simple moving averages shown below are based on the following periods: - 3, 6,9,12,15,18,21.
If you want to use multiple moving averages as ENTRY for trading you can use the following technique. You will notice that once the multiple moving averages start consolidating and trading close to each other, there is often a high volatility breakout resulting in a good trend. In order to take advantage of this is a good idea to straddle the consolidation with support and resistance trendlines and to place a buy pending order above the resistance trendline and a Sell pending order below the support trendline. This will ensure that you ENTER the volatility breakout.
So the consolidation of the multiple moving averages warns us of a possible breakout and we can then straddle the consolidation using trendlines and place orders above the consolidation to ENTER the breakout.
1.2 Straddle Trading
1.2.1 General straddle techniques
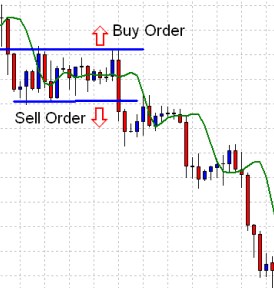
A straddle is simply a technique where you place a pending order above the price action (current trading consolidation) and below it. It is commonly used when the market’s next direction is uncertain as in picture above. Announcement times are also times of uncertainty where the straddle approach can be used. However brokers tend to increase spreads in such potentially highly volatile times (announcements) which makes this approach more risky.
This approach is particularly handy at any time when the market is likely to trend but you don’t know which direction.
An example of a horizontal straddle
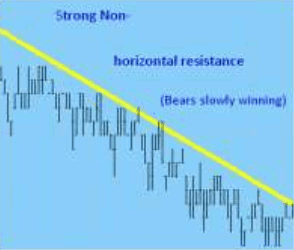
An example of a non horizontal straddle
Some practical examples
Here the market is trading sideways in a manner where there are no clear trading signals.
The moving average is flat and the price will keep on trading through the moving average.
At this point nobody knows what is going to happen.
This is a good time to straddle the width of the consolidation and let the market decide where it wants to go.
You straddle the market by putting a buy pending order above the consolidations and a sell pending order below the consolidation.
Price patterns also make straddle opportunities. In this triangle an upper trendline resistance develops at the same time lower trendline support develops creating a triangle (the version shown in this example is actually a wedge).
The price could breakout either way so placing a buy above the resistance trendline and a sell order below the support trendline creates a great straddle trade.
1.2.2 Announcement straddles
Major announcements can cause the biggest and quickest movements in the market. Many times the breakout direction is not clear and that’s when a straddle strategy is a good strategy to follow. Brokers are inclined to increase spreads at this time so make sure you are using a broker that does not do that. Also make sure that you are using a broker with a robust trading system so that the price is less likely to jump over your entry.
Straddle the price by placing a buy and sell pending order 15 to 20 pips from the price just before the announcement.
1.2.3 Weekend GAP straddles
The weekend straddle is a specialized version of a straddle making use of the fact that Forex market trades 7 days a week 24 hours a day. Brokers however like closing their trading facilities over weekends.
News worthy events such a G7 or G10 meetings and political speeches during weekends can cause the Forex market to move and causes a weekend gap on the Broker dealing station. Not all brokers allow this type of trade so do your homework.
ENTRY: You would simply enter a buy pending or and a sell pending order 5 to 10 pips above or below the price just before (last minute) the time the broker closes their dealing station on a Friday. You would then close the deal the minute the broker opens their dealing station on a Monday.
Finding a broker that allows this trade is a challenge. Please don’t discuss this with your broker as they do not like this trade.
1.3 Channel trading
Channel trading is very easy for Forex Traders. All you need are 3 actual turning points in the market (points 1, 2 and 3 below) and you can then project the 4th and the 5th and so on. So Channel trading provides great projected BOUNCE trading opportunities.
The Price can channel for a very long time
To enter a channel trade BOUNCE trade you would simply put a Pending order to trade back into the channel at the price level the projected channel bounce is likely to occur.
A failed channel swing occurs when a channel is identified and the price fails to reach the next anticipated channel bounce point. See the chart below.
When a failed swing occurs the chances of a channel BREAKOUT is particularly big.
Should the breakout occur there is a strong likelihood that the target will be the width of the previous channel. You would then ENTER the market on the channel line breakout as shown below.
The example below illustrates these points quite well.
1.4 Price Patterns
We are now going to discuss the 4 most important formations used for entering trades.
The first 2 are reversal formations which occur mainly at the end of a trend. The Head and Shoulders (Reversed Head and shoulders) formations and the Double Top (Double bottom) formations occur quite regularly at the end of strong upwards or downward trends.
Below is the Head and shoulder formation. You would enter when the price breaks through the neckline as shown.
The double top reversal formations at the end of a trend. Again you would enter on the breakout of support as shown.
A Trading exampleThe next is a continuation formation called the continuation flag formation consisting of a good trend (Flag pole), a sideways consolidation (Flag) and then the continuation.
A trading example
You would enter when the price breaks out of the price consolidation (The Flag). Pending orders can be used.
Triangles are price patterns that occur when uncertainty exists in the market and the currency starts trading in smaller consolidating ranges. The direction of a breakout is uncertain and it is then a time to use a straddle by placing a buy and sell order just outside the triangle.
1.5 Horizontal and non Horizontal support or resistance
General introduction to Support and resistance
SUPPORT AND RESISTANCE
All competent and experienced Forex Traders use Support and Resistance concepts to trade, so this is a very important area.
Resistance refers to the upper barrier that gets created by the BEARS defending the price from going higher.
Support refers to the lower barrier that gets created by the BULLS defending the price from going lower.
Non horizontal Support refers to the lower barrier that gets created by the BULLS who are slowly winning the battle and pushing the price higher.
Non horizontal Resistance refers to the upper barrier that gets created by the BEARS who are slowly winning the battle and pushing the price lower.
What happens in reality is that the BEARS and BULLS determine borders that they are willing to fight and die for every day. Therefore the charts become a bulls and bears battle ground map.
What some traders find tricky is that these borders can be both horizontal and non horizontal, as we in fact experience in between countries. As with countries that have drawn border lines, these border lines become embedded in the memory of the market participants. They remember the wars that were fought. They remember the casualties and victories. Even after many generations.
So expect some emotion when the price reaches these areas. Expect a fight. Our job is to determine who has the biggest army and the biggest guns. They are the ones that will win the battle and when they do, there will be a definite victory as evidenced by a big candle.
When the bulls win and move past the border, the BEARS often muster up the ability to fight back and chase them back to the breakout border. The original historic border will again be the place of a massive fight. That is why there is an old trading expression that “support becomes resistance” or “resistance becomes support”.
Now, these battlefields and borders are well marked on the trading maps to those who know how to find them and identify them. Especially those who think like the BULLS and the BEARS and remember to honour past battles.
To those who do not honour history, it will look like just another desert on the map. Those who know the history of the past battles will know that the land is sacred and worth fighting for. Your job is to become an expert at history so that you can predict the place where the battle will take place. Once you have done that you need to read the signs that tell you which group will win the battle.
As mentioned, some of these levels reverse their role once violated. Support becomes resistance or resistance becomes support. This phenomenon helps us identify these areas of historic support and resistance more clearly.
The slide and chart below shows how one price level can act as both support and resistance
Non Horizontal support and resistance is best identified when the price bounces off trendlines or channel lines as shown below.
The possibility of a BREAKOUT through support or resistance is increased when:
- The price has already retested the breakout level a number of times. Sooner or later the breakout will occur.
- The volumes are low when the price trends toward the breakout point. This means that the market is not resisting the breakout.
- If the trend towards the breakout point is highly motivated by fundamental news
- If other currencies are breaking through similar support and resistance levels
- If you are trading in a volatile time of day.
Basic technique on How to trade BOUNCE points using Visible Support and resistance (used by BOUNCE traders)
- Find strong support and resistance price levels.
- Assume that the support or resistance will create a BOUNCE based on the guidelines.
- Place a pending order or use a market order to enter a BOUNCE off the support and resistance level
- Enter stops and targets appropriate to your currency, timeframe and time of day
- Amend this approach based on your own experience.


0 Komentar
Post a Comment